Adenosine Triphosphate (ATP) bioluminescence, an indirect measurement of the amount of organic residue on a surface (live or dead), has been commonly used to evaluate cleanliness of food preparation surfaces for more than forty years and research has shown it is effective in assessing cleanliness in other environments such as schools and office settings.1,2,3
ATP is an energy molecule found in plant and animal microbiol cells including food, bacteria, mold and other microorganisms. ATP is measured in relative light units (RLU) which is the measurement of light emitted from a reaction between ATP and swab reagent. Viruses such as SARS-CoV-2 cannot generate or store energy in the form of ATP and ATP surface testing does not measure viruses; however, ATP measurements can be useful for evaluating the effectiveness of hygiene interventions aimed at preventing viral spread in the workplace.4 RT-qPCR (Reverse Transcription, quantitative-Polymerase Chain Reaction) is a technique used to measure viral RNA and can test for the presence of SARS-CoV-2 on environmental surface samples.
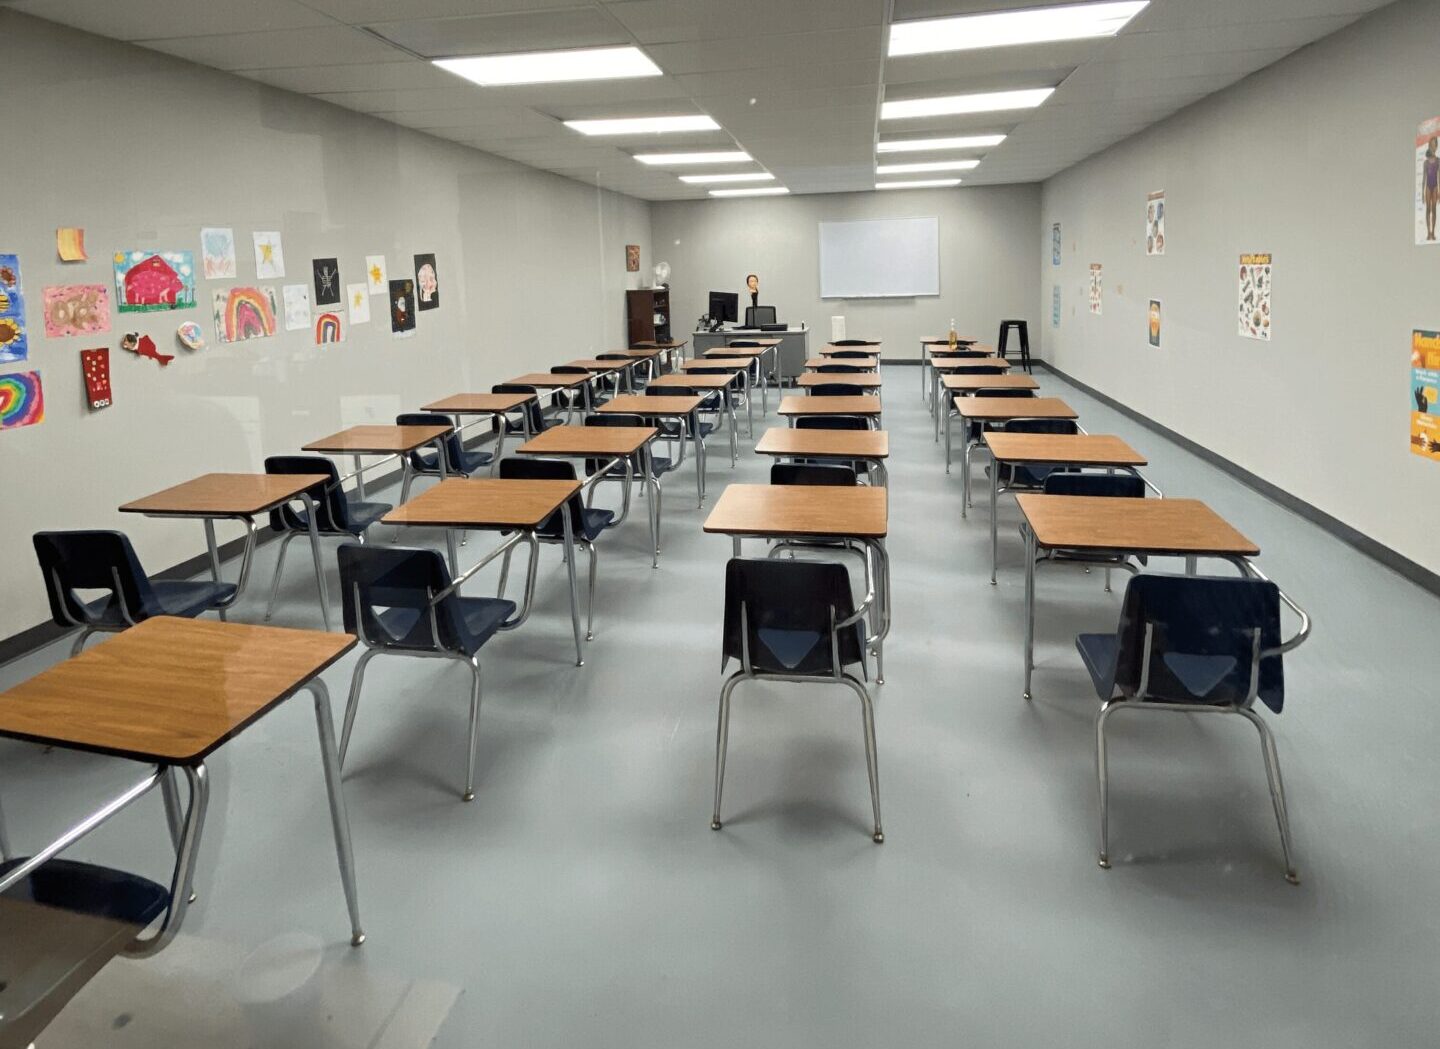
In order to visualize and assess cleaning procedures as compared to normal background levels measured in various settings, three simulated sneeze scenarios were conducted in a simulated classroom setting, each followed by a different cleaning procedure (occupant (teacher), routine janitorial, and hired professional). Each sneeze was comprised of a viscus liquid containing both a fluorescent dye and surrogate pathogen and each scenario assumed an infectious disease plan was in place but without management oversite.
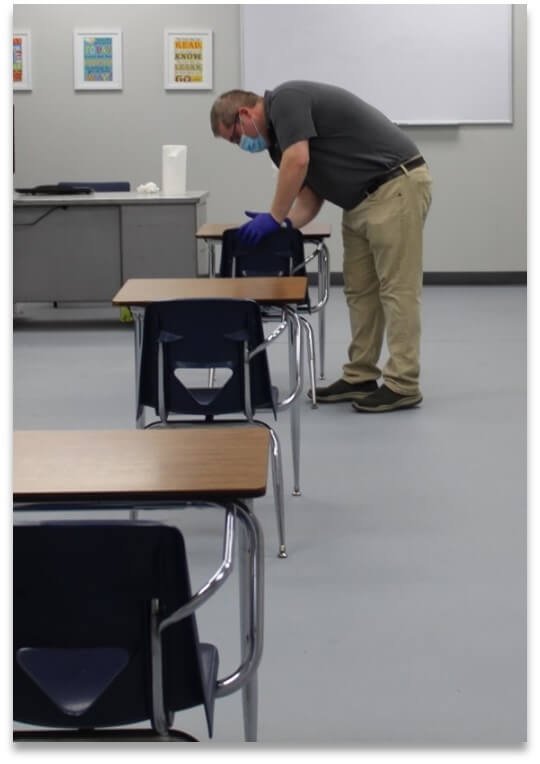
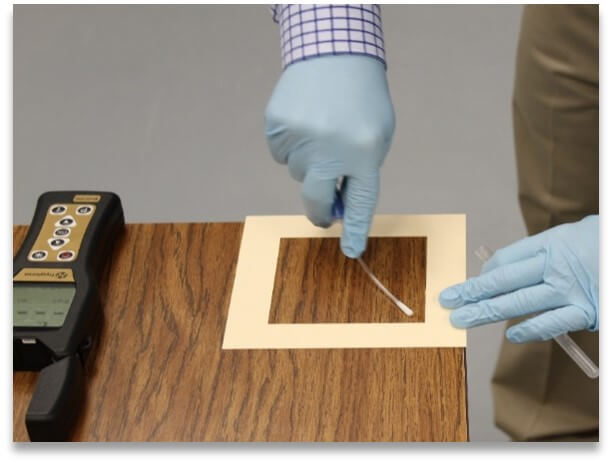
Effectiveness of each cleaning scenario was assessed by observing the extent of visible florescent dye using an overhead black light and collecting measurements of pathogen loading that remained on eight (8) highly used touch point surfaces using ATP bioluminescence and bacterial sampling throughout the classroom space (e.g., tables, chairs, electronics) after each scenario.
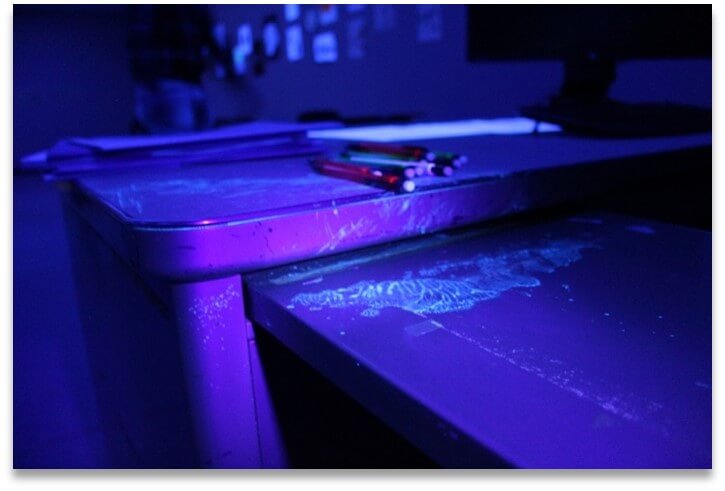
As shown in Figure 3, visible florescent dye was identified on the desks, floor, doorknob, whiteboard, and occupants’ hands from sharing materials following each scenario.
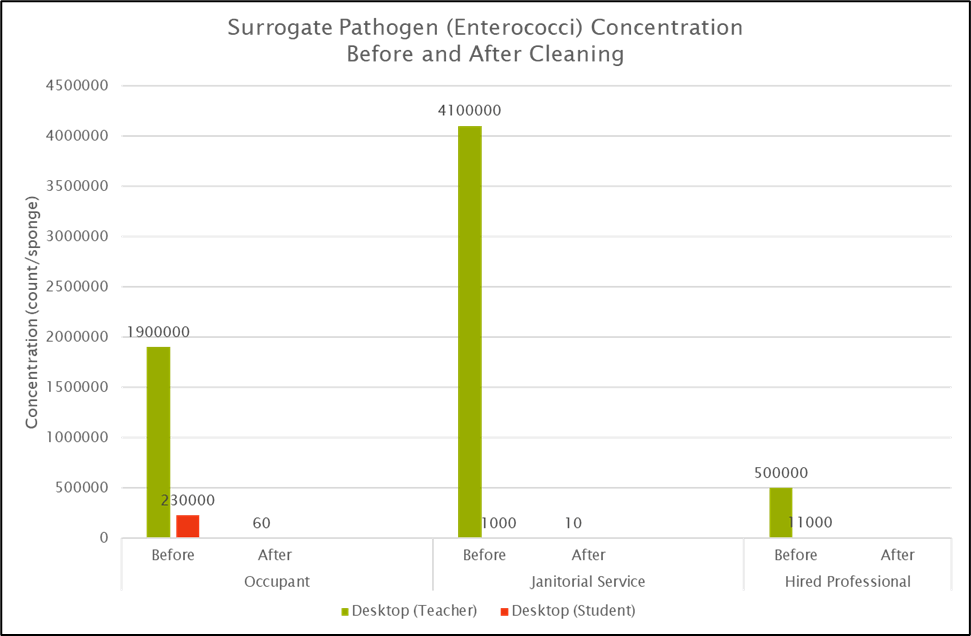
ATP swab samples were collected before and after each cleaning scenario at each of the eight pre-defined locations. The surrogate pathogen allowed for the dosing of these locations which was identified by elevated ATP in the pre-cleaning samples. Bacterial samples, which were analyzed for the bacteria present in the surrogate pathogen (Enterococci), were collected before and after cleaning from the teacher and student desk.
As shown in Figure 4, ATP results indicated that the janitorial cleaning methods were the most efficiently with an 80% decrease in ATP between pre- and post-cleaning measurements. The occupant (teacher) cleaning methods following the first scenario was the lightest in scope and provided the lowest overall average decrease of 45%. The hired professional industrial company was between each of the other two scenarios with a 68% decrease in ATP between pre- and post-cleaning measurements.
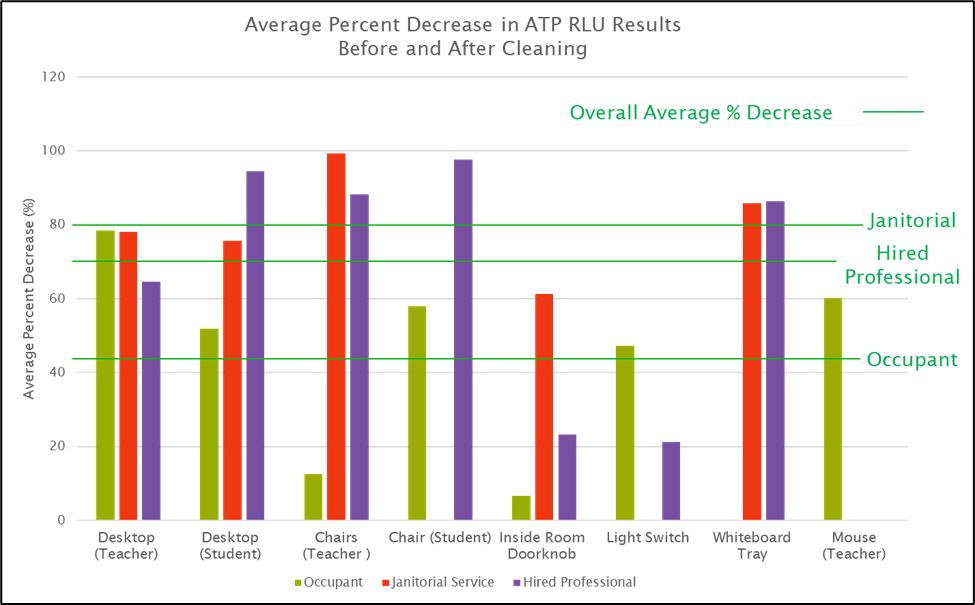
Biological sampling results, as displayed in Figure 4, indicated that the hired professional industrial cleaning service was the most effective in disinfecting surfaces, reducing each sample location to below the level of detection after cleaning. Bacteria was detected following each of the other scenarios.
To understand ATP background “normal” values compared to those measured within the assessment, background samples were gathered from a variety of surfaces including an office desk, an industrial machine, a school table, and home countertop. ATP background “normal” results collected varied in range from 88 – 1312 RLU.
As seen in the results of the background “normal” samples, background ATP can be present at elevated concentrations as ATP is present in live and dead organic material. Each assessment must be conducted by first setting and understanding a clean value by collecting ATP measurements following site specific cleaning procedures. The control values can then be used to set limits for specific assessments. It is also important to understand the limitations of the ATP assessment process to assess cleaning efficiency. It is recommended that ATP testing be performed after cleaning and ATP samples should not be collected from porous, soft, or otherwise distinctly different surfaces or material types.
Overall, it was concluded that the cleaning scenario chosen influenced the effectiveness of removing and/or inhibiting the visual loading and pathogen concentration as compared to background levels. The results support the importance of developing a specific cleaning and disinfecting plan and assessing and revising the plan based on effectiveness. Collecting bacteria or pathogen specific samples following ATP monitoring of cleaning efficiency can also indicate whether the chosen disinfectant and disinfection process is successful in killing any contaminants.
The Harvard T.H. Chan School of Public Health defines methodology to assess efficacy as three (3) routes of COVID-19 transmission supported by models and case studies which include close-contact transmission, long-range transmission (airborne), and fomite transmission.5
Effective solutions to manage occupancy and combat disease transmission should not be limited to a single control mechanism or practice, instead multiple control measures should be implemented to add layers of protection such as social distancing, cloth masks, personal hygiene, and engineering and administrative controls that work together to reduce risk.
For more on RHP Risk Management’s Exposure Sciences Case Studies, visit: rhprisk.com/case-studies
1 Sifuentes, L. Y., Fankem, S. L., Reynolds, K., Tamimi, A. H., Gerba, C. P., & Koenig, D. (2017). Use of ATP Readings to Predict a Successful Hygiene Intervention in the Workplace to Reduce the Spread of Viruses on Fomites. Food and environmental virology, 9(1), 14-19.
2 https://www.cdc.gov/hai/toolkits/evaluating-environmental-cleaning.html
3 Turner, D. E., Daugherity, E. K., Altier, C., & Maurer, K. J. (2010). Efficacy and limitations of an ATP-based monitoring system. Journal of the American Association for Laboratory Animal Science : JAALAS, 49(2), 190–195.
4 Shaughnessy, R. J., Cole, E. C., Moschandreas, D., & Haverinen-Shaughnessy, U. (2013). ATP as a marker for surface contamination of biological origin in schools and as a potential approach to the measurement of cleaning effectiveness. Journal of occupational and environmental hygiene, 10(6), 336-346.